GetApp Data, Integrations, and SaaS Success
By
Contents:
Highlights:
- In 2019, GetApp evaluated over 4,000 different SaaS products across 29 business software categories
- 383 products ranked as “Category Leaders,” with 29 crowned overall “Category Winners”
- Integration was weighted equally to the other four ranking factors
- The product’s integrations comprised 75% of the Integration factor score
- In most categories, an opportunity exists to leverage more/better integrations to gain on your competition
- In some categories, a high Integration score was required for inclusion in the Top 15
- Read our Analysis and Conclusions
Introduction: Our Quest for Data
Do integrations drive B2B SaaS success?
What is the relative impact of integrations versus other priorities?
We’ve spent the past few years researching these questions. We’ve interviewed hundreds of SaaS leaders to hear their confidential perspectives and anecdotes. We’ve also closely tracked a handful of company public statements and “case studies” that speak to the ROI of integrations.
While “research by anecdote” is mildly helpful, it can never escape the YMMV tag. That’s why we are in a perpetual search for a broader dataset with three critical characteristics:
- Evaluates hundreds of SaaS with a common methodology
- Measures integrations with a numerical score
- Compares multiple measured factors
Late last year we finally stumbled across such a dataset: GetApp’s 2019 “Category Leaders” rankings.
This post provides our meta-analysis of GetApp’s 2019 rankings and some observations on the relationship between robust integrations and B2B SaaS success.
About GetApp and its Methodology
GetApp is a software review and research business owned by the preeminent IT research and advisory firm Gartner. Gartner’s commitment to independence is respected across many industries and technologies.
As part of the Gartner family, GetApp benefits from an enormous amount of data shared by its sister sites Capterra and Software Advice. Together they boast more than one million verified software reviews.
Category Leaders and Winners
Since 2015 GetApp has published an annual ranking of SaaS products across 29 categories. In 2019 they evaluated over 4,000 different products and then updated each category’s “Top 15” with new scores and stack ranking.
“Category Leaders” are announced on a rolling category-by-category basis throughout the year. All 29 categories are named in our category table below.
Each category has a Winner, the highest scoring (and thus top-ranked) product. GetApp doesn’t use the term “Category Winner,” but we do herein.
In 2019 GetApp included 383 unique products across its 29 categories, with 38 products ranked in multiple categories. Of these “multiples,” 31 products appeared in two categories, four appeared in three categories, two appeared in four categories, and one appeared in five categories: Bitrix24, the Swiss Army knife of SaaS products.
Five Ranking Factors
Read GetApp’s full scoring methodology for 2019, but here’s our summary.
A 100 point total breaks into five equal “factors,” listed here by relative importance:
- product security features (“security” for 20 points)
- user input (“user reviews” for 20 points)
- compatibility with other systems (“integrations” for 20 points)
- mobile offerings (“mobile” for 20 points)
- technical capabilities (“functionality” for 20 points)
If two products received the same overall score, GetApp re-ranked them based on relative factor importance, i.e. security > reviews > integrations > mobile > functionality.
The fact that GetpApp considers integrations influential but equal to the other factors is the key to our analysis (below).
The (Integration) Weight: 75%, 25% open API
The Integration Scoring Factor is comprised of two related components:
Five points are awarded if the product has an open API; up to 15 points are awarded based on an assessment of the product’s integrations.
GetApp’s weighting confirms advice we often give our SaaS clients: an API is no longer enough (if it ever was.)
With this 75/25 weighting, GetApp recognizes the market reality that B2B customers are expecting no-code, self-serve options, not “here’s our API, go hire a developer” solutions.
GetApp’s methodology also recognizes that each category has its own set of “common” integrations. To score highly, a product needs its “category common” integrations to be at least as good as the competition, if not better.
Left Hook Analysis and Observations
Initial Observation
Our first blush hunch about the GetApp Category Leaders data seemed promising: we noticed that of the 29 Category Winners, 21 of the 29 also earned the top Integration factor score.
This appeared meaningful, until we realized that 14 of these 21 “Double Winners” actually tied for integrations with at least one other product, with most (12 of 14) tied with three or more other products. One category (Project Management) had a 12-way tie on integrations, with all twelve products scoring a perfect 20.
While the Integration factor score for each of the 29 winners was on average 63% higher than the category mean, this seemed less impressive given all the tied scores.
Understanding Integration vs Other Ranking Factors
To really understand the relative importance of Integration on the GetApp rankings, we needed to get statistical, i.e. understanding the distribution of various data points.
Our ugly chart won’t end up on Pinterest, but it does reveal the primary insight we gained from GetApp’s data:
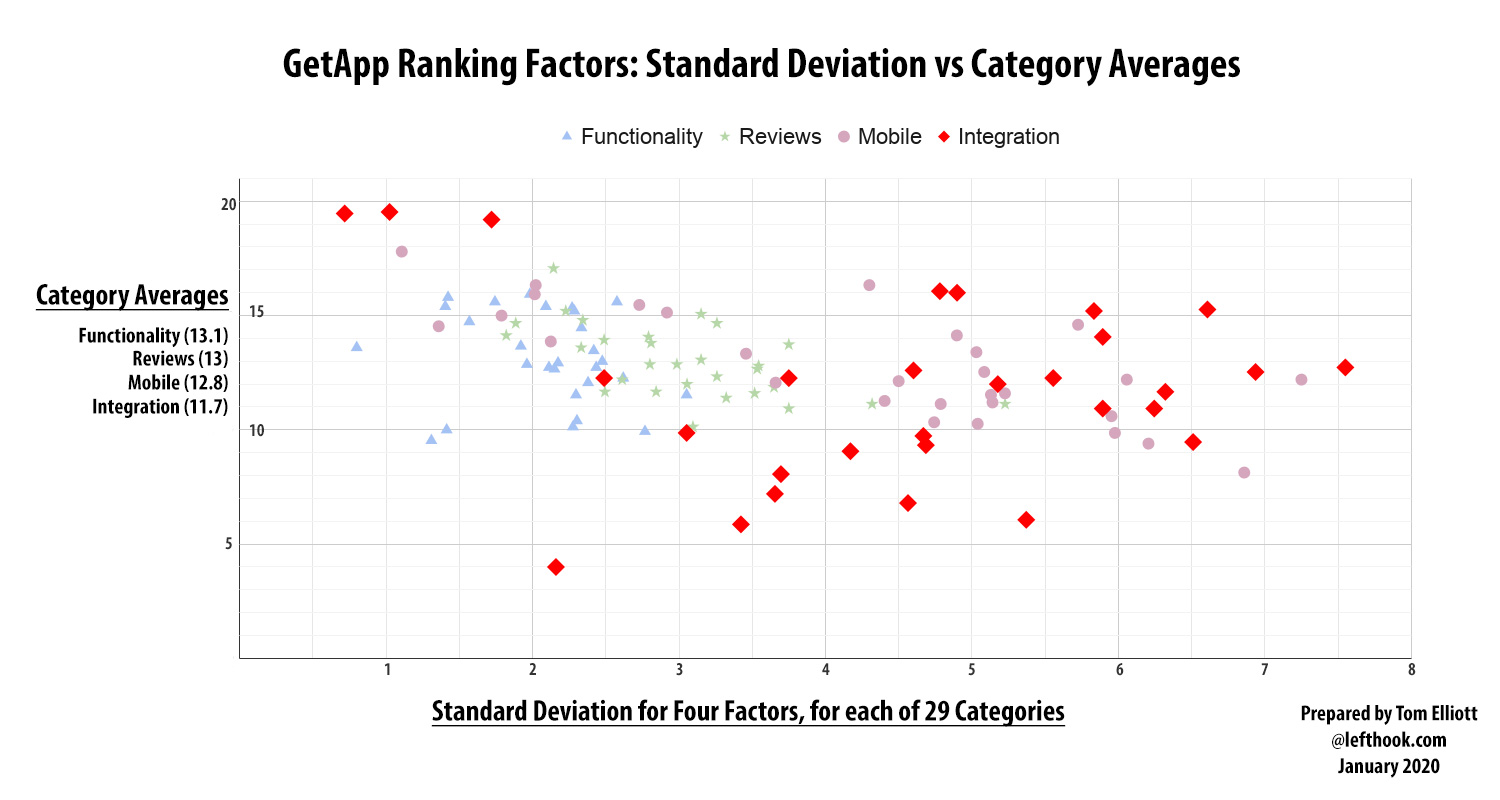 CHART 1: the further to the right on the X axis, the more variance in a category. The higher on the Y axis, the higher category average.
To build this graph, we first had to calculate the Standard Deviation and Category Averages for each factor (4) and each category (29).
You’ll note that we didn’t include GetApp’s fifth ranking factor, Security. After reviewing 432 scorecards for each product, we came to view Security (as scored by GetApp) an invalid ranking metric. Why? Because 80 products scored zero for Security, an astounding 18.5% of all products assessed.
We speculate that most of these zeros were the result of various companies either refusing or neglecting to submit required “vendor-completed security survey.” As a customer of products with both high and low Security scores, it’s our judgement that many “zeros” are actually average in security, but still received a GetApp goose egg.
Omitting Security doesn’t skew our results. Again, our experiment measures the relative importance of one ranking factor compared against three other competing factors. The absence of the fifth ranking factor makes our results less interesting perhaps, but not invalid.
Factor Variance Patterns
On to the results. As you’ll see on our chart (above or below), the four different ranking factors show two different patterns.
Functionality and Reviews both have relatively lower variance, i.e are more tightly grouped around their averages. You can see how the little blue triangles and green stars are closer to the left side of the chart, and are more tightly grouped around their average.
Integration stands out as looking very different. Look for the red diamonds (one for each of the 29 categories) and where they fall on the chart. For 23 out of 29 categories, standard deviation is greater than 3.
In those 23 categories Integration scores swung wildly. Take Time & Expenses, which had 15 products with Integration scores ranging from 0 to 20. You can’t get more variance than that!
Also note that the Mobile ranking factor has relatively high variance as well, looking more like Integration than Functionality or Reviews.
Ok, enough of all this math stuff. What does it mean?
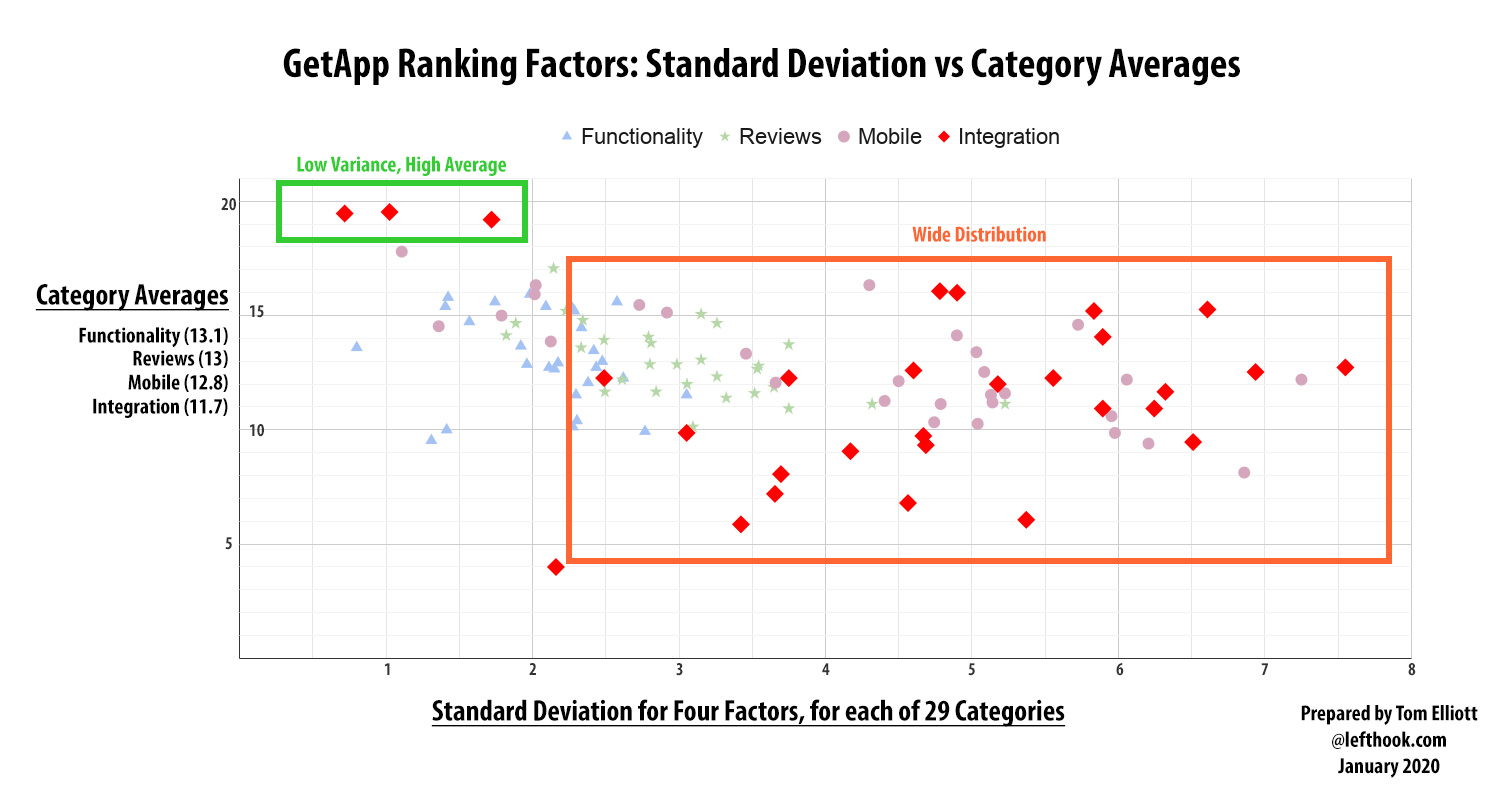 CHART 2: The further to the right on the X axis, the more variance in a category. The higher on the Y axis, the higher category average. Red and Green boxes explained in “Observations” below.
Observation #1: Integration=Impactful Differentiation
The “high variance” pattern (red box in the chart above) suggests that if your product can “hang around the hoop” with slightly above-average scores for Functionality and Reviews, then more/better integrations will likely provide impactful distinction.
The data also suggests that if your product’s Functionality and Reviews aren’t yet slightly above average, go focus on them first. (Duh.) But having the most fully-featured and highest reviewed product won’t necessarily make you a Category Leader, because, well, integrations matter.
The Mobile factor follows the same pattern, although statistically less than Integration. This fact is less interesting that it appears. (Here’s why.1)
But back to the big picture: the GetApp data suggests a clear “Integration differentiation opportunity” in most categories.
Example: Employee Scheduling
Let’s talk about one representative category, Employee Scheduling. The Category Winner is Deputy(#1), followed by BranchMessenger (#2) and Findmyshift (#3).
Deputy scored a perfect 20 on Integration, more than double the category average. But on Reviews and Functionality, Deputy didn’t even come close to winning, with multiple other products scoring slightly higher on both.
But because so many products cluster near the relative high averages for Functionality and Reviews, and because Deputy only scored slightly above average in both, it was able to win the category through its strong Integration score.
And despite generally high variation for Mobile overall (compared to Functionality and Reviews), it so happens that Employee Scheduling’s Mobile variance was very low (1.11).
Employee Scheduling is one of those categories for which a high Mobile score is required to rank, as all fifteen products scored within a tight 16-20 point window. A high integration score wasn’t required to rank. But it was required to win. This is true in many categories, which is the key insight gained through our analysis.
Observation #2: Integration is “Table Stakes” in Some Categories
Also interesting are the three categories in the upper left area of our chart (green box, chart above), showing high category average and low variance.
These are three of the categories noted above with tied and perfect integration scores. They are:
- Email Marketing: High Score of 20 in a six-way tie; Integration Category Average is 19.5
- Project Management: High Score of 20 in an eleven-way tie; Integration Category Average is 19.5
- Live Chat: High Score of 20 in a twelve-way tie; Integration Category Average is 19.2
These three categories feel extreme. How can 12 out of 15 competitors in Live Chat score a perfect 20? (Put the product managers for Drift, Intercom, Front, and LiveChat around the same table and you’d probably get some interesting answers.)
We could offer informed opinion on how Project Management is a crowded and mature market with 428 products scored by GetApp… but then ERP, also a mature category (and 164 entrants) shows low variance AND low average scores. CRM, with 350 products scored including behemoths SalesForce, Hubspot, and Microsoft Dynamics, also shows relatively low variance but middling Integration scores (average of 12.3)
The “why” is interesting but elusive. One possible conclusion is that GetApp’s scoring methodology is unevenly applied across the categories, especially in those ranking factors that are dependent on “research team judgement.”
Regardless of the why, here’s the reality: if your product wants to compete for the Top 15 in Live Chat (or Email Marketing, or Project Management), you better show up to the party with a boatload of integrations, which are effectively “table stakes” to enter the “Category Leader” arena.
A Second Test for Integration Impact
The Variation Distribution tests above provide a nuanced look at the relative impact of Integration on overall GetApp scoring success. However, we wanted to see what would happen when you replaced nuance with a sledgehammer.
Our second simple “brute force” test: remove Integration from the overall scores, to see how its absence would effect category rank.
The results: 6 of 29 Category Winners would lose their crowns, though five of the six would fall to second place.
Of the Top 3 in all categories, 16 would fall off the podium. (16 of 87).
Of the Top 5 in all categories, 22 would fall out of the Top 5. (22 of 145).
Overall the average rank loss was -2.2 for the 150 products that lost rank (151 of 432). 129 products gained rank, while 153 products stayed the same.
This “remove integrations” exercise didn’t create any overwhelming chart-worthy effect on product rankings.
We take this result as a reminder that while more/better integration remains an opportunity to distinguish your product, the lack of them isn’t likely to spell certain doom for your B2B SaaS, either.
In Conclusion
Do these results tell us anything useful about the relative importance of integration to SaaS success?
When you step back and view the entire data set, the honest answer is, “Meh. A little.”
As excited as we were to find a dataset of this scope and detail, the deeper we scratched the more we questioned GetApp’s methodology and its uneven application on various categories.
In our view, here are three of GetApp’s particularly problematic methodology choices:
- Weighting Functionality equal to everything else. Functionality should be king over any other factor.
- Weighting Mobile equal to anything else. Mobile should be an aspect of Functionality, but not its own ranking factor.
- Weighting Security equal to other factors, then scoring almost 20% of all ranked products with zeros.
Despite GetApp’s methodology or scoring flaws, we gained some valuable insight of use to SaaS leaders making bets on where to invest precious resources to grow their businesses.
And again the headline: high variance in most categories suggests that there is an opportunity to leverage more/better integrations to distinguish yourself from the competition.
And if winning a GetApp category is one of your OKRs in 2020, get busy optimizing your scorecard!
The Quest Continues. What’s Next?
We’re thankful for GetApp and its investment in the Category Leader process.
We’d love to see competitors like G2 put its enormous data to work on these questions… and perhaps doing all this math for us 🙂
Meanwhile, Left Hook is recruiting SaaS partners to enumerate the role integrations play in their company success.
We’re also exploring sources and partners that would allow us to correlate financial performance with integration offerings, to see if we can define “SaaS success” with dollars.
Want to join us in this data quest? Think your company would make a good case study? Know of another broad data set we can analyze?
GetApp Category Table
Each GetApp category ranking is linked to open in a separate tab.
| Product Category | Category Winner |
|---|---|
| Accounting | Quickbooks Online |
| Application Tracking ATS | Workable |
| Business Intelligence Tools | MIcrosoft Power BI |
| Business Management12 | Avaza |
| Call Center | Aircall |
| CRM | SalesForce |
| Customer Service | FreshDesk |
| Document Management | Dropbox |
| Email Marketing | MailChimp |
| Employee Scheduling | Deputy |
| ERP | NetSuite |
| Event Management | Eventbrite |
| Expense Management | SAP Concur |
| Facilities Management | UpKeep |
| Field Service | Jobber |
| Human Resources | ADP Workforce Now |
| Instant Messaging & Chat | Slack |
| Inventory Management | Zoho Inventory |
| IT Service Management | Zendesk |
| Learning Management | TalentLMS |
| Live Chat | LiveChat |
| Marketing Automation | Mailchimp |
| Point of Sale | Shopify |
| Project Management | Asana |
| Project Portfolio Management | Wrike |
| Reservation & Online Booking | Setmore |
| Social Media Marketing | Mailchimp |
| Survey | SurveyMonkey |
| Time & Expense | Zoho Invoice |
| 12 Each category includes 15 "Category Leaders," with the singular exception Business Management (12). | Current as of 1/22/2020 |
Data Table
Want to drill down into your product’s specific category numbers? Here is a Google Spreadsheet with the Standard Deviation and Category Average Scores for all 29 categories in the four ranking factors (Functionality, Reviews, Mobile, and Integration).
NOTE: Each Category needs a separate row each ranking factor. This format allowed us to graph each of the four factors with different colors/shapes in the charts above.
Footnote 1: Mobile is a weak ranking factor that is undeserving of its weighting in GetApp’s methodology. Out in the business wilderness, a robust mobile app is important when the primary user workflow truly requires a mobile experience, i.e. Uber drivers or event ticket takers.
Looking across the 432 products scored, we’re hard-pressed to find 100 products with users that really, truly need a strong Mobile app. In future years, we’d recommend that GetApp demote the Mobile aspect to become a meaningful sub-component of the overall Functionality score.
We know- somewhere a boutique IOS consultancy is ripping us on Twitter for our self-interested hypocrisy. But after decades of cumulative browser-based business software experience, common sense tells us that integration matters for most B2B software use cases, while a robust mobile app matters for some business use cases.
About the Author

Tom Elliott
Tom is the Co-Founder and CEO of Left Hook. Read more about Tom on:
Want to discuss this post? chat with us anytime.